- Insert › Chart › Pie › OK adds an editable chart with its own small data sheet.
- Type over the sample data and drag the blue outline so it covers only your rows.
- Chart Design › Quick Layout › Layout 1 puts names and percentages on every slice.
- Right-click › Insert Caption adds a numbered “Figure 1” caption.
- Word for the web can’t insert charts: make one online and insert it as an image.
Word can make a real, editable pie chart inside your document. You don’t need to build it in Excel first. Behind the chart sits a small spreadsheet. You type your numbers into it and Word redraws the pie as you go. This guide covers every step on Windows and Mac. It also covers the parts most tutorials skip: making the sample data go away, wrapping text around the chart, adding a numbered caption, and what to do in Word for the web, which can’t insert charts.
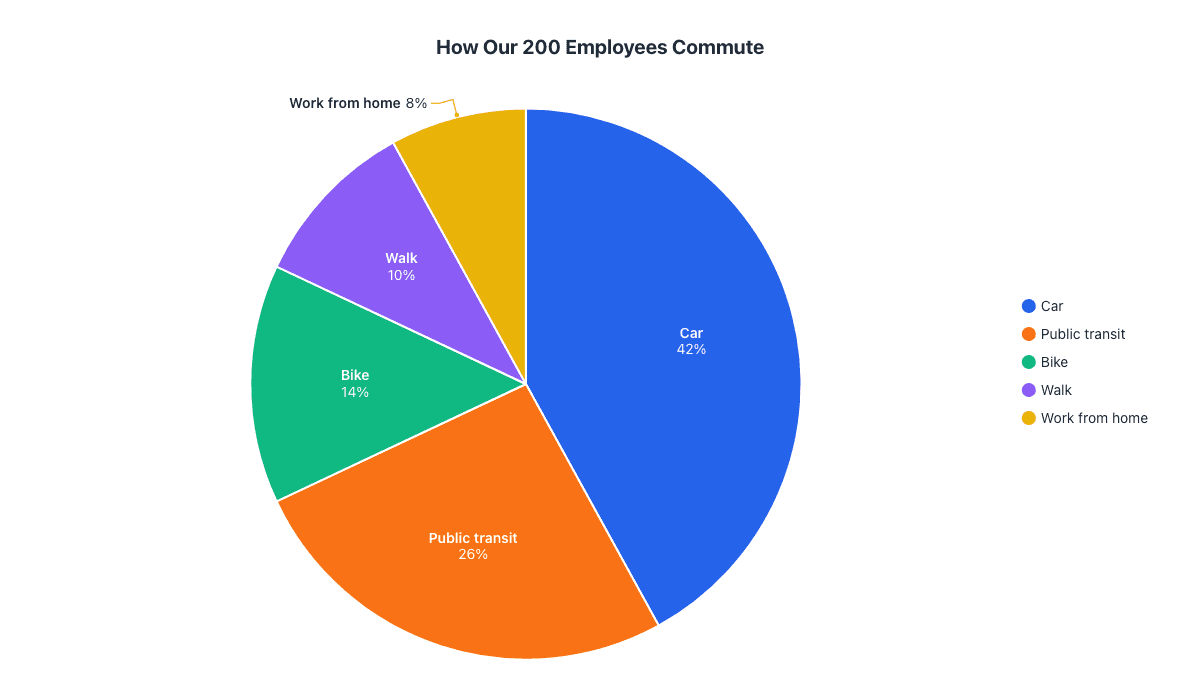
Our example is a staff survey that asked 200 employees how they get to work, the kind of chart that ends up in a report or newsletter.
Step 1: Insert a pie chart
- Click in your document where the chart should go.
- Open the Insert tab and click Chart in the Illustrations group.
- In the Insert Chart dialog, pick Pie in the list on the left.
- Choose the first option, a plain 2-D Pie, and click OK.
Menu path: InsertChartPieOK
The same dialog also offers 3-D Pie, Pie of Pie, Bar of Pie and Doughnut. Start with the plain pie. It is the easiest to read, and you can switch type later with Chart DesignChange Chart Type.
On a Mac: click InsertChartPiePie. Word opens a separate Excel window for the data instead of a small one inside Word, but every other step is the same.
Step 2: Replace the sample data with yours
As soon as the chart appears, a small spreadsheet window titled Chart in Microsoft Word opens with placeholder figures (Sales by 1st, 2nd, 3rd and 4th Qtr). Type over them:
- Put your category names in column A and your numbers in column B.
- Change the header in B1. Word uses it as the chart title, so “Employees” or “Commute survey” is better than “Sales”.
- Look for the blue outline around the data. Only cells inside it are charted. If you have more than four categories, drag its bottom-right corner down to cover all your rows. If you have fewer, drag it up, or the leftover sample rows stay in the chart.
- Close the spreadsheet window with its × button. Your chart stays in the document.
Our survey data, once typed in:
| Commute | Employees | Share |
|---|---|---|
| Car | 84 | 42% |
| Public transit | 52 | 26% |
| Bike | 28 | 14% |
| Walk | 20 | 10% |
| Work from home | 16 | 8% |
You only type the first two columns. Word works out the percentages itself. If you want to check them yourself, our guide to calculating pie chart percentages shows the method.
Step 3: Show percentages on the slices
Word’s default pie has no numbers on it, only a legend, so readers have to guess the sizes. There are two ways to add labels.
The one-click way: click the chart and choose Chart DesignQuick LayoutLayout 1. This puts the category name and percentage on every slice and removes the legend you no longer need.
The custom way, if you want more control:
- Click the chart, then click the + (Chart Elements) button at its top-right corner.
- Tick Data Labels, click the arrow beside it and choose More Options.
- In the Format Data Labels pane, tick Percentage, untick Value, and tick Category Name if you plan to delete the legend.
- Under Label Position, choose Best Fit or Outside End so labels on small slices don’t overlap.
Menu path: Chart Elements (+)Data LabelsMore OptionsPercentage
On a Mac, there’s no + button. Use Chart DesignAdd Chart ElementData LabelsMore Data Label Options instead.
Step 4: Style it to match your document
- Sort your data from largest to smallest in the data sheet. The slices then run clockwise from 12 o’clock in size order, which is the easiest way to read a pie.
- Pick a color scheme with Chart DesignChange Colors. These follow your document’s theme, so the chart matches your headings.
- Recolor one slice: click the pie once to select all slices, click again to select just one, then right-click › Fill. Use a strong color only for the slice you want readers to notice.
- Pull out a slice: select a single slice and drag it outward, or set Point Explosion in Format Data Point.
- Try a ready-made style with the paintbrush button beside the chart, or the Chart Styles gallery on the Chart Design tab.
Step 5: Position the chart and add a caption
Word inserts charts In Line with Text, which means the chart behaves like one very large letter. That is usually what you want in a report: it stays where you put it and moves with the paragraph. Center it with HomeCenter (or Ctrl+E).
If you want text to flow beside the chart, click the Layout Options button next to it and choose Square or Tight. Drag a corner handle to resize the chart. Corner handles keep its shape, so the pie doesn’t stretch into an oval.
To give the chart a numbered caption like “Figure 1: How our employees commute”:
- Right-click the chart and choose Insert Caption.
- Keep the label as Figure, type your text after the number, and choose to place it below the chart.
Menu path: ReferencesInsert Caption
Captions number themselves. If you add a chart earlier in the document, the later figures renumber, and ReferencesInsert Table of Figures can list them all, which helps in theses and long reports.
Already have the chart in Excel? Paste it in
If your data and chart already live in an Excel workbook, don’t rebuild them. Click the chart’s border in Excel, press Ctrl+C, click in Word and press Ctrl+V. Then click the Paste Options icon that appears and choose how the chart should behave:
| Paste option | What you get | Best for |
|---|---|---|
| Keep Source Formatting & Embed Workbook | An editable chart with its own copy of the data, stored inside the document | Documents you’ll send to others |
| Keep Source Formatting & Link Data | A chart that updates when the Excel file changes | Monthly reports built from a workbook you keep updating |
| Use Destination Theme (Embed or Link) | The same as above, but recolored to match your Word theme | Keeping charts consistent with the document |
| Picture | A flat image that can’t be edited | Final versions where nobody should change the numbers |
If you linked the chart, refresh it with Chart DesignRefresh Data after editing the workbook. Links break if the Excel file is moved, renamed or isn’t on the reader’s computer, so embed instead when you’re emailing the document. Our Excel pie chart guide covers building the chart on that side.
Making a pie chart in Word for the web
Word for the web, the free version at office.com, can’t insert new charts. It can display charts made in the desktop app, but there is no Chart button on its Insert tab. You have two options:
- If you have desktop Word: choose EditingOpen in Desktop App at the top of the ribbon and follow the steps above.
- If you don’t: make the chart elsewhere, download it as an image, and add it with InsertPicturesThis Device. The next section shows the quickest way to do that.
The faster way: make the chart online and insert it as an image
A built-in Word chart is the right choice when you’ll keep editing the numbers inside the document. When you just need a clean, finished chart, it is often faster to make it in the pie chart maker and drop it in as a picture. Type or paste your two columns, and the chart is drawn with percentage labels placed so they don’t overlap. There’s no sign-up and no watermark.
Which format to download:
- SVG is the best choice for Word in Microsoft 365, Word 2021 and Word 2019. It is a vector image, so it stays perfectly sharp at any size and when printed.
- PNG works in every version of Word, Google Docs and Word for the web. Choose the Full HD or 4K size so it doesn’t look blurry when printed.
Common problems and how to fix them
| Problem | Fix |
|---|---|
| “1st Qtr” or other sample categories are still in the chart | Open Edit Data and drag the blue outline so it covers only your rows, or delete the extra rows. |
| The chart title says “Sales” | The title comes from cell B1 of the data sheet. Change it there, or click the title and type over it. |
| There is only one slice, or slices are named 1, 2, 3 | Word read your data the wrong way round. Open Edit Data, then click Chart DesignSwitch Row/Column. |
| Edit Data is grayed out | The chart was pasted as a picture, or it’s linked to a workbook Word can’t find. Rebuild it with Insert › Chart, or paste it again using an Embed Workbook option. |
| The chart jumps to another page or covers text | Set Layout Options to In Line with Text. Charts set to Square or Tight move as you edit the text. |
| Percentages add up to 99% or 101% | That’s rounding. Show one decimal place under Number in Format Data Labels. |
| Too many thin slices to read | Group anything under about 3% into “Other”, or use a bar chart instead (see when not to use a pie chart). |
Frequently asked questions
Why can't I insert a chart in Word for the web?
The free web version of Word has no Chart button. Open the document in the desktop app, or make the chart online, download it as PNG and use Insert › Pictures.
How do I edit the data of a pie chart in Word?
Click the chart, then choose Chart Design › Edit Data, or right-click the chart and pick Edit Data. Pick Edit Data in Excel for a full Excel window.
How do I show percentages on a Word pie chart?
Choose Chart Design › Quick Layout › Layout 1, or open Chart Elements (+) › Data Labels › More Options and tick Percentage.
How do I stop sample data like '1st Qtr' appearing in my chart?
Open Edit Data and drag the blue outline around the data so it covers only your rows, or delete the leftover sample rows.
Should I paste an Excel chart into Word as linked or embedded?
Embed it if you'll send the document to others. Link it only when the chart must update from a workbook you keep editing on the same computer.
Make your own chart in seconds
Free, no sign-up, no watermark. Download PNG, SVG or PDF.
Open the Pie Chart Maker