- Insert › Chart › Pie › OK adds an editable chart with its own data sheet.
- Chart Design › Quick Layout › Layout 1 puts names and percentages on the slices.
- Set chart text to 16–18 pt so it reads from the back of the room.
- Animations › Wheel › Effect Options › By Category reveals one slice per click.
- For a finished image, make the chart online and paste it in, or insert an animated MP4.
PowerPoint has pie charts built in, and they stay editable: behind every chart is a small spreadsheet you can reopen at any time. This guide shows how to insert one, replace the sample data, put percentages on the slices, style it for your slide and make the slices appear one at a time when you present. It covers PowerPoint for Microsoft 365 on Windows and Mac, PowerPoint 2019 and later, and PowerPoint for the web.
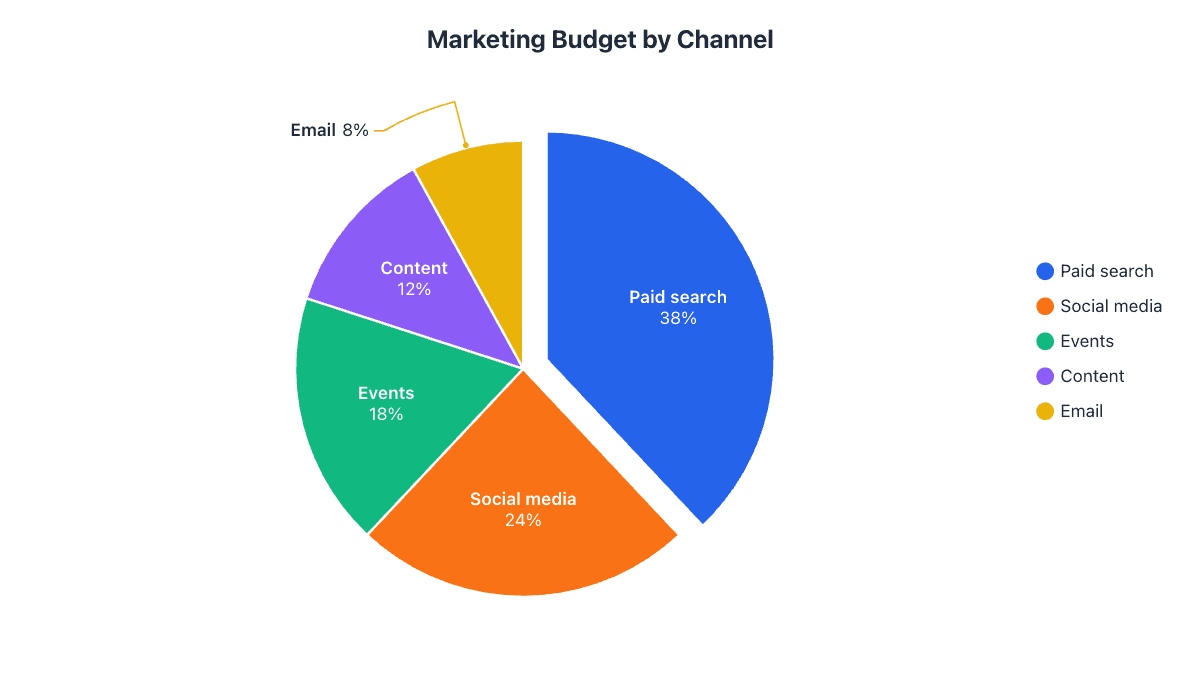
Our example is a $250k marketing budget split across five channels, the kind of slide you’d show in a quarterly review.
Step 1: Insert a pie chart
- Go to the slide where the chart should go.
- Open the Insert tab and click Chart. (On a slide with an empty content placeholder, you can also click the small chart icon inside it.)
- Pick Pie in the list on the left, choose the first 2-D Pie, and click OK.
Menu path: InsertChartPieOK
The same dialog has 3-D Pie, Pie of Pie, Bar of Pie and Doughnut. You can switch type later with Chart DesignChange Chart Type, so start with the plain pie.
Step 2: Type in your data
A spreadsheet window titled Chart in Microsoft PowerPoint opens with sample sales figures. On a Mac, the data opens in Excel instead. Replace the samples:
- Category names go in column A, numbers in column B. Cell B1 becomes the chart title.
- Make sure the colored outline around the data covers exactly your rows. Drag its corner if you have more or fewer than four categories, or old sample rows stay in the chart.
- Close the window. To change the numbers later, click the chart and choose Edit Data.
| Channel | Budget ($k) | Share |
|---|---|---|
| Paid search | 95 | 38% |
| Social media | 60 | 24% |
| Events | 45 | 18% |
| Content | 30 | 12% |
| 20 | 8% |
Menu path to reopen the data: Chart DesignEdit Data
Step 3: Put percentages on the slices
The default chart only has a legend. On a slide, labels directly on the slices are much easier to read from the back of the room.
Quickest: click the chart, then Chart DesignQuick LayoutLayout 1. This adds the name and percentage to every slice and removes the legend.
For more control: click the + (Chart Elements) button next to the chart, tick Data Labels, then open its arrow › More Options. In the Format Data Labels pane, tick Category Name and Percentage, untick Value, and set Label Position to Best Fit. On a Mac, use Chart DesignAdd Chart ElementData LabelsMore Data Label Options.
Step 4: Style it for your slide
- Colors: Chart DesignChange Colors uses your presentation theme, so the chart matches the rest of the deck.
- Highlight one slice: click the pie once (all slices are selected), then click one slice again to select just that one. Give it a strong color with FormatShape Fill and make the rest gray.
- Pull it out: with one slice selected, drag it outward, or set Point Explosion in the Format Data Point pane.
- Rotate the pie: right-click a slice › Format Data Series and change Angle of first slice so the slice you’re talking about sits where you want it.
- Sort first: order the data from largest to smallest in Edit Data, so the slices run clockwise from 12 o’clock by size.
Step 5: Animate the slices one by one
Revealing one slice at a time keeps the audience with you as you talk through each part:
- Select the chart.
- On the Animations tab, choose Wheel (or Wipe or Fade).
- Click Effect Options and, under Sequence, choose By Category.
Menu path: AnimationsWheelEffect OptionsBy Category
Each click now reveals the next slice. Open the Animation Pane to change the timing, or set the slices to start After Previous so they play on their own.
Already made the chart in Excel?
Copy the chart in Excel (click its border, Ctrl+C), click the slide and press Ctrl+V. The Paste Options button lets you choose between:
- Use Destination Theme & Embed Workbook (the default): editable, recolored to match your slides, with its own copy of the data.
- Keep Source Formatting & Link Data: updates from the Excel file, but breaks if the file is moved or the deck is sent to someone without it.
- Picture: a flat image nobody can change. Best for the final version you send out.
Our Excel pie chart guide covers building the chart on the Excel side, and the Word guide uses the same Paste Options.
PowerPoint for the web
The free web version at office.com can insert a pie chart from InsertChartPie and edit its data, but it has far fewer formatting options than the desktop app. For full control over labels, colors and animation, click Editing › Open in Desktop App, or make the chart elsewhere and insert it as a picture.
The faster way: make the chart online and paste it in
If you don’t need to edit the numbers inside PowerPoint, it’s often quicker to build the chart in the pie chart maker, where labels are placed automatically and small slices get leader lines. Then bring it into your deck:
- Copy image and paste straight onto the slide.
- SVG via InsertPicturesThis Device stays sharp on any projector. In Microsoft 365 you can even ungroup it into editable shapes.
- Video: the animated MP4 download plays the slices sweeping in. Add it with InsertVideoThis Device and set it to start automatically.
- Match the deck with a transparent PNG and a theme that uses your brand colors.
Common problems and how to fix them
| Problem | Fix |
|---|---|
| Sample categories like “4th Qtr” still show | Open Edit Data and shrink the outlined range to your rows, or delete the extra rows. |
| Only one slice, or slices named 1, 2, 3 | Your data is the wrong way round. Open Edit Data and click Chart DesignSwitch Row/Column. |
| Labels overlap on thin slices | Set label position to Best Fit or Outside End, or group small slices into “Other”. See when not to use a pie chart. |
| Edit Data is grayed out | The chart was pasted as a picture, or its linked workbook is missing. Insert it again as an embedded chart. |
| Animation reveals the whole pie at once | Set Effect Options › Sequence to By Category. |
| Percentages add up to 99% or 101% | That’s rounding. Show one decimal place under Number in Format Data Labels. |
Frequently asked questions
How do I animate each slice of a pie chart in PowerPoint?
Select the chart, choose an animation such as Wheel or Wipe on the Animations tab, then open Effect Options and choose By Category under Sequence.
How do I edit the data in a PowerPoint pie chart?
Click the chart and choose Chart Design › Edit Data, or right-click the chart and pick Edit Data.
Can PowerPoint for the web make pie charts?
Yes, from Insert › Chart › Pie, but with fewer formatting options than the desktop app. Open the file in the desktop app for full control.
How do I show percentages instead of values?
Use Quick Layout › Layout 1, or Chart Elements (+) › Data Labels › More Options and tick Percentage instead of Value.
How do I rotate a pie chart in PowerPoint?
Right-click a slice, choose Format Data Series and change Angle of first slice.
Make your own chart in seconds
Free, no sign-up, no watermark. Download PNG, SVG or PDF.
Open the Pie Chart Maker