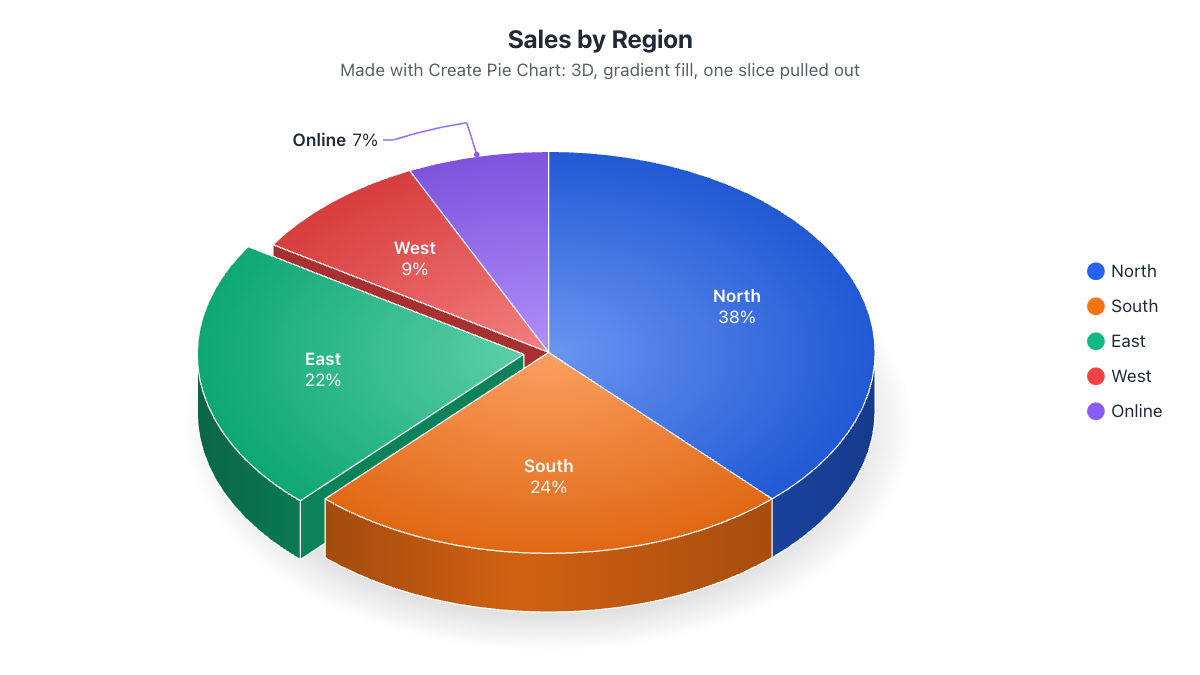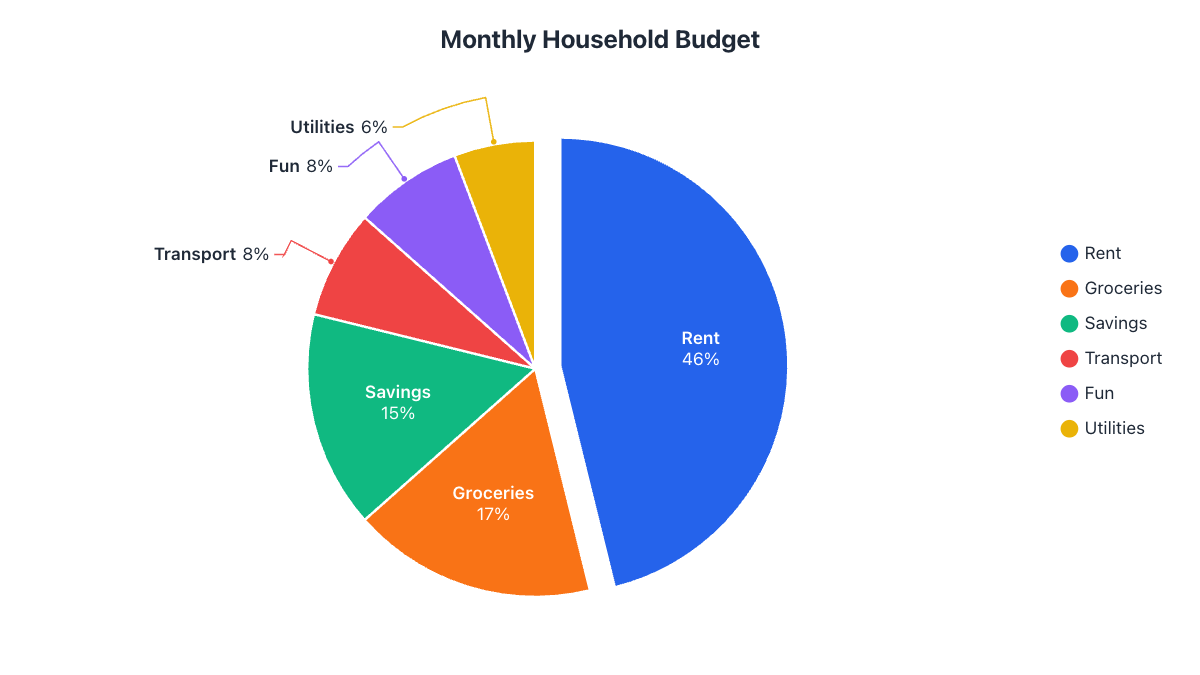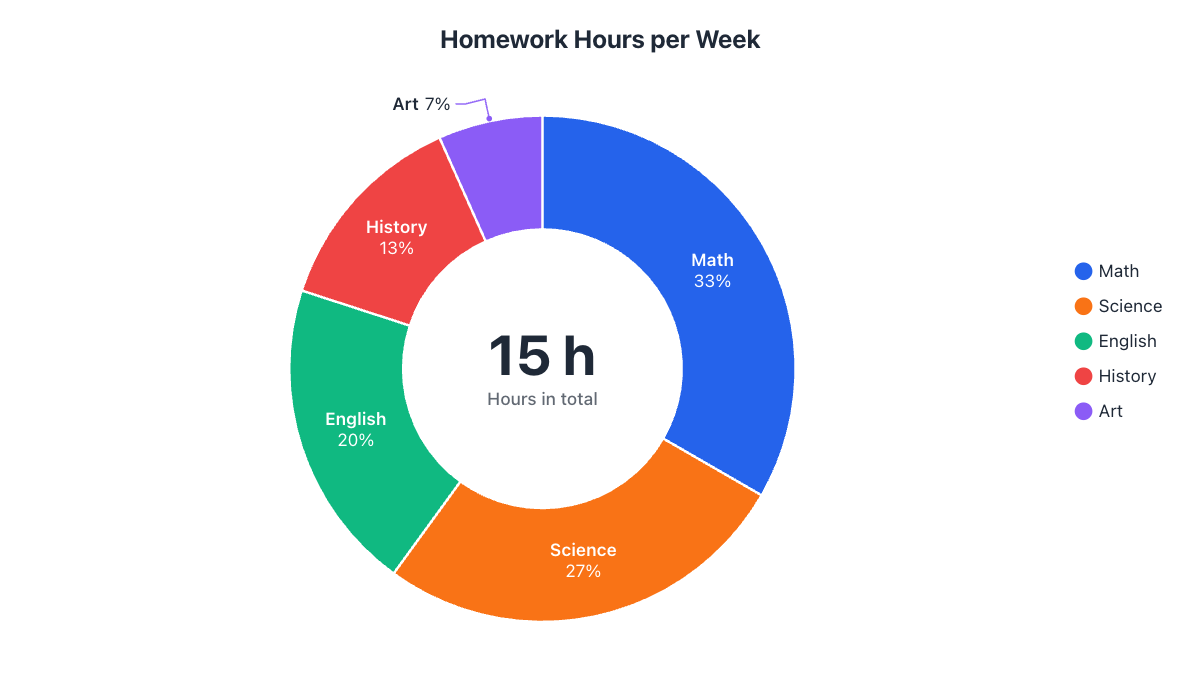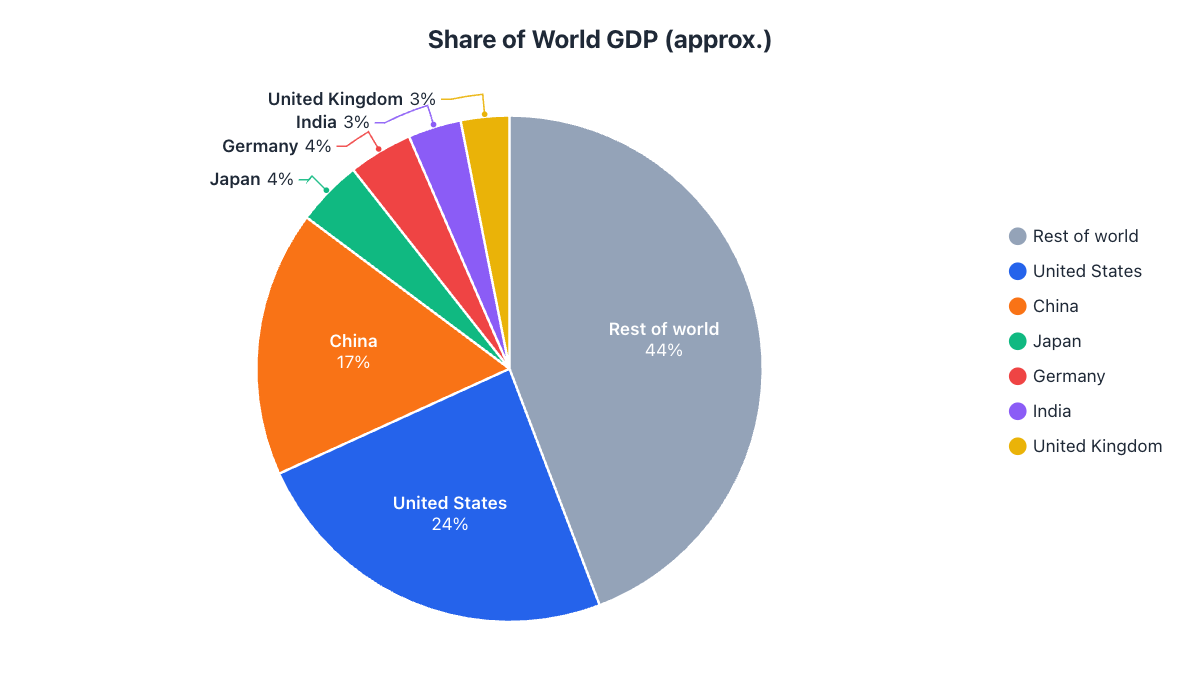
- Use a pie only for parts of one whole that add up to 100%.
- For changes over time use a line graph; to compare values precisely, a bar chart.
- Beyond about seven slices, group the small ones into 'Other'.
- Pie charts can't show negative or zero values.
Pie charts have a bad reputation among data designers, but the problem is rarely the pie itself. It’s using a pie for data it wasn’t made for. A pie chart answers one question very well: how is this whole divided? Ask it anything else and it struggles. Here are six situations where you should reach for a different chart, and what to use instead.
1. The parts don’t add up to a whole
A pie chart says “these slices together are 100% of something”. If they aren’t, the chart is misleading. Common examples:
- Survey questions where people could pick several answers (the shares add up to more than 100%).
- Unrelated numbers, like the population of five cities that aren’t a complete set.
- Averages or rates, such as average test score per class.
Use instead: a bar chart. Bars compare sizes without implying they form a whole.
2. You want to show change over time
Twelve pie charts for twelve months force readers to compare slices across charts, which people do badly. Trends are about direction and rate of change.
Use instead: a line graph, with one line per category. You can make one free with the line graph maker. To compare just two points in time, a nested pie chart with one ring per year also works.
3. Too many slices
Beyond about seven slices, colors start to repeat or blur together, labels collide and small slices become slivers. Here is each country’s approximate share of world GDP (rounded, for illustration), with twelve countries plus the rest of the world:
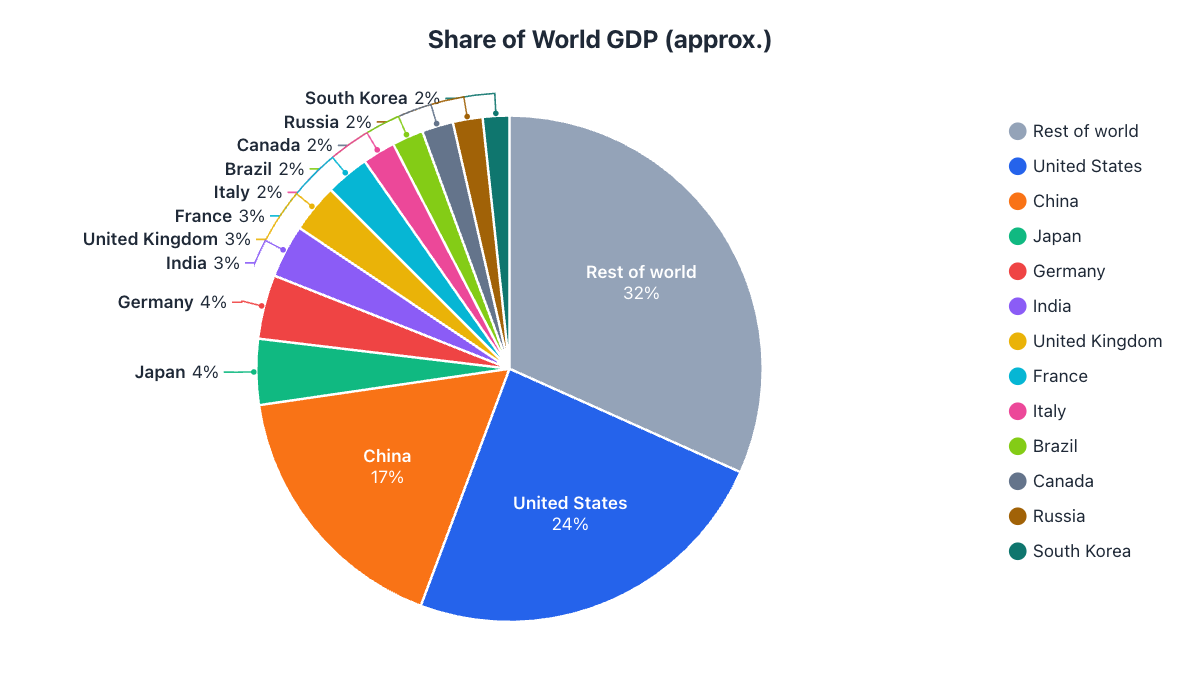
Fix it: keep the important categories and group everything under a threshold (say 3%) into “Other”, or into an existing catch-all like “Rest of world”. The chart at the top of this article is the same data after grouping: seven slices instead of thirteen, and every label fits. If every category matters individually, use a sorted bar chart instead.
4. The values are almost the same
Is a 23% slice bigger than a 21% slice? Readers can’t tell by eye: people judge angles and areas far less accurately than lengths. If your message depends on small differences, a pie hides it.
Use instead: a bar chart sorted from largest to smallest, or keep the pie but label every slice with its exact percentage.
5. Some values are negative or zero
A slice can’t have a negative size, so profit and loss, temperature changes or net migration can’t go in a pie. Zero values simply disappear.
Use instead: a bar chart with bars going up for positive and down for negative values.
6. You need to compare several groups in detail
Comparing how five departments each split their budget means comparing five pies, slice by slice. That’s hard work for the reader.
Use instead: a 100% stacked bar chart, with one bar per group. For two or three groups, nested rings in a nested pie chart keep the parts-of-a-whole message while lining the groups up.
When a pie chart is the right choice
None of this means pie charts are bad. They are often the best choice (and a donut can be even better, see pie chart vs. donut chart) when:
- The slices are parts of one clear whole and add up to 100%.
- There are only a few slices, ideally two to seven.
- The message is about proportions: “almost half”, “a quarter”, “the smallest share”.
- The audience is broad, since nearly everyone understands a pie at a glance.
How to rescue a crowded pie chart
- Group small slices into “Other”. In the pie chart maker, turn on “Group small slices into Other” in the Labels tab and choose the threshold.
- Sort from largest to smallest so the eye moves naturally around the circle.
- Label slices directly with name and percentage. Let small slices use outside labels with leader lines so nothing overlaps.
- Highlight one slice, either by pulling it out or by muting the others to gray, so readers know what to look at.
- Use patterns for print. If the chart will be printed in black and white, pattern fills keep slices distinguishable.
Frequently asked questions
How many slices is too many for a pie chart?
More than about seven. Beyond that, colors blur together and small slices become hard to label; group the smallest into 'Other'.
What should I use instead of a pie chart?
A bar chart to compare sizes, a line graph for changes over time, and a 100% stacked bar to compare how several groups are divided.
Are pie charts bad?
No. They're one of the clearest charts for showing how a whole is divided into a few parts. Problems come from using them for other kinds of data.
Can I use a pie chart for survey results?
Yes, if each person gave exactly one answer, so the answers add up to 100%. For multiple-choice questions where people pick several answers, use a bar chart.
Make your own chart in seconds
Free, no sign-up, no watermark. Download PNG, SVG or PDF.
Open the Pie Chart Maker