- Insert › Chart › Pie adds a chart linked to a new Google Sheet in your Drive.
- Click the chart's link icon › Open source to edit its data and design.
- Customize › Pie chart › Slice label › Percentage adds percentages.
- Click Update on the chart in Docs to pull in changes.
- The Docs app on phones can't insert charts; use a computer or insert an image.
Google Docs can add a pie chart to a report, essay or proposal in a few clicks. The chart’s data lives in a linked Google Sheet, so editing it means a quick trip to Sheets and back. This guide covers inserting the chart, entering your data, adding percentages, placing it in your text, and the shortcut when you just need a finished image.
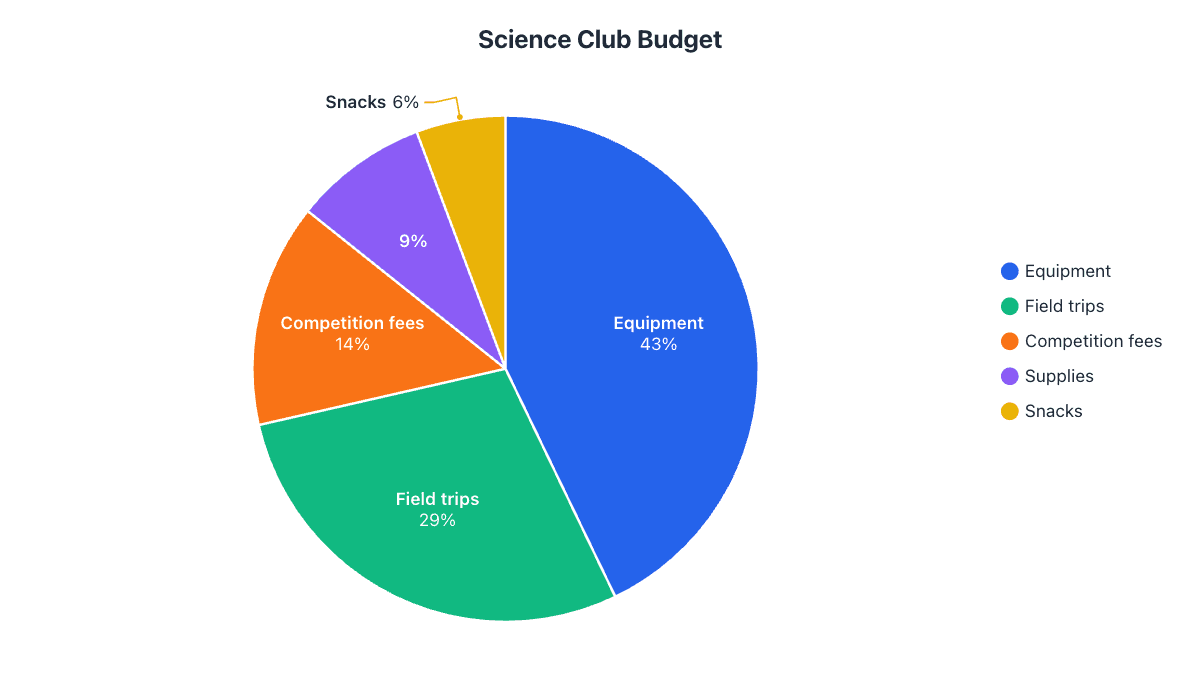
Our example is a school science club’s $1,050 yearly budget, the kind of chart that goes into a club report or a funding request.
Step 1: Insert a pie chart
- Click in the document where the chart should go.
- Choose InsertChartPie.
A chart with sample data appears. Google Docs has also created a new spreadsheet in your Drive that holds this data; the chart is linked to it.
Step 2: Replace the sample data
- Click the chart once to select it.
- Click the link icon at its top-right corner and choose Open source. The linked spreadsheet opens in a new tab.
- Type your categories in column A and amounts in column B. Delete leftover sample rows, and don’t include a total row: it would become a slice.
| Category | Amount ($) | Share |
|---|---|---|
| Equipment | 450 | 43% |
| Field trips | 300 | 29% |
| Competition fees | 150 | 14% |
| Supplies | 90 | 9% |
| Snacks | 60 | 6% |
Step 3: Add percentages and style it
Styling also happens in the spreadsheet. Double-click the chart in Sheets to open the Chart editor, then use the Customize tab:
- Pie chart › Slice label › Percentage puts percentages on the slices. Choose Value and percentage to show both.
- Pie slice changes each slice’s color, and Distance from center pulls one out.
- Chart & axis titles sets the title. For a document, a plain descriptive title works best, such as “Science Club Budget, 2026”.
- Chart style › Background color set to none blends the chart into the page.
The Google Sheets pie chart guide goes through every Chart editor setting.
Step 4: Update the chart in your document
Switch back to your document. An Update button appears on the chart; click it to pull in the new data and design. Docs doesn’t update linked charts automatically, so do this after every change. For documents with several charts, ToolsLinked objects › Update all refreshes them together.
Step 5: Position the chart in your text
Click the chart and use the options bar that appears under it:
- In line treats the chart like a character in the text. It’s the most stable choice for reports: center it with the alignment buttons and it moves with its paragraph.
- Wrap text lets text flow around the chart, useful for a smaller chart beside a paragraph.
- Break text keeps text above and below the chart only.
Drag a corner handle to resize without stretching the pie. For a caption, type a line under the chart such as “Figure 1: Science club budget by category” in a smaller, italic style.
For screen readers, right-click the chart and add Alt text that states the key numbers, for example “Pie chart: equipment 43%, field trips 29%, competition fees 14%, supplies 9%, snacks 6%”.
Insert a chart that already exists in Sheets
If the spreadsheet and chart already exist, choose InsertChartFrom Sheets, pick the file and the chart, and click Import. Leave Link to spreadsheet ticked to keep the Update button, or untick it for a fixed copy that never changes.
The faster way: make the chart online and insert it as an image
A linked chart is ideal when the numbers will change. For a finished chart in an essay or report, it’s usually quicker to make it in the pie chart maker: type or paste the data, and labels and percentages are placed for you, with leader lines on thin slices. Then click Copy image and paste it into the document, or download a PNG and choose InsertImageUpload from computer. The tool’s Alt text button writes the description for you.
Common problems and how to fix them
| Problem | Fix |
|---|---|
| No Update button after editing the sheet | The chart may be unlinked. Re-insert it with Insert › Chart › From Sheets with Link to spreadsheet ticked. |
| The chart shows sample data or an extra slice | Delete leftover rows in the sheet, or fix the data range in the Chart editor’s Setup tab. |
| Small slices have no labels | Sheets hides labels that don’t fit. Group small categories into “Other” or show values in the legend. |
| The chart jumps around when you edit text | Set it to In line instead of Wrap text. |
| The chart looks different after downloading as Word | Docs exports charts as pictures. If you need an editable chart in Word, follow the Word pie chart guide. |
Frequently asked questions
How do I edit a pie chart in Google Docs?
Select the chart, click the link icon at its top-right corner and choose Open source. Make your changes in Google Sheets, then click Update on the chart in the document.
Can I make a pie chart in Google Docs on my phone?
Not with Insert › Chart, which the mobile app doesn't offer. Make the chart on a computer, or create it online, download a PNG and insert it as an image.
How do I add percentages to a Google Docs pie chart?
Open the linked sheet, double-click the chart, and in Customize › Pie chart set Slice label to Percentage. Then click Update in Docs.
Why is there a spreadsheet in my Drive I didn't create?
Google Docs creates one for every chart you insert. It holds the chart's data; deleting it stops you from editing the chart.
Make your own chart in seconds
Free, no sign-up, no watermark. Download PNG, SVG or PDF.
Open the Pie Chart Maker