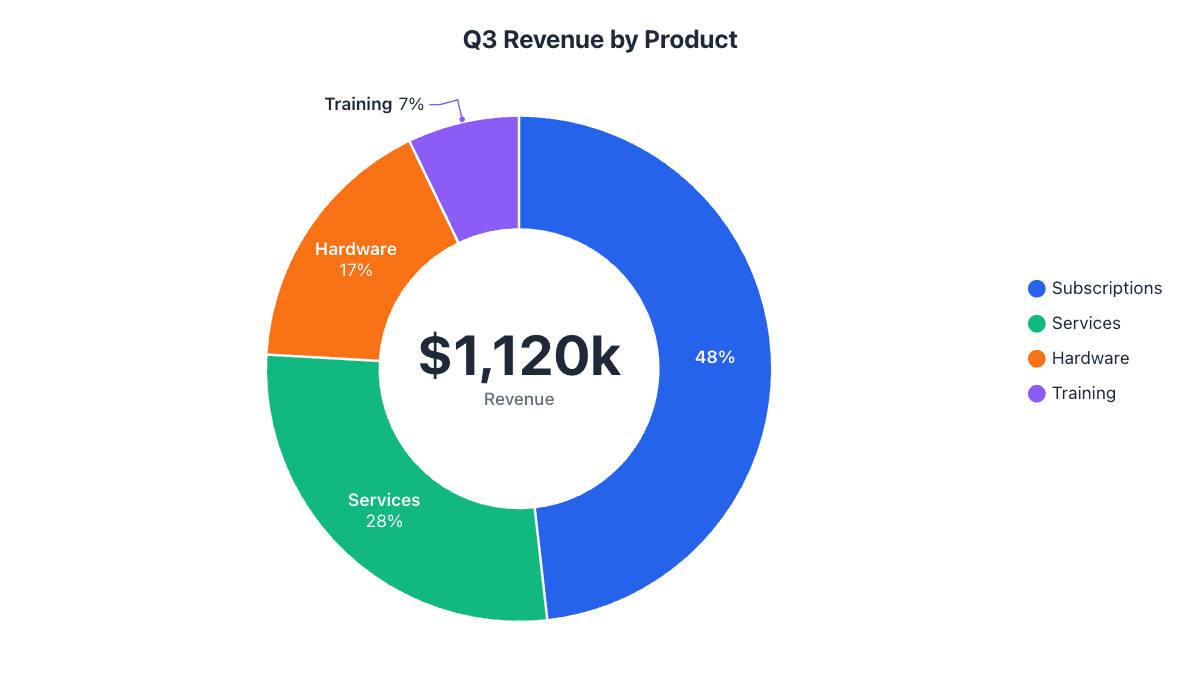
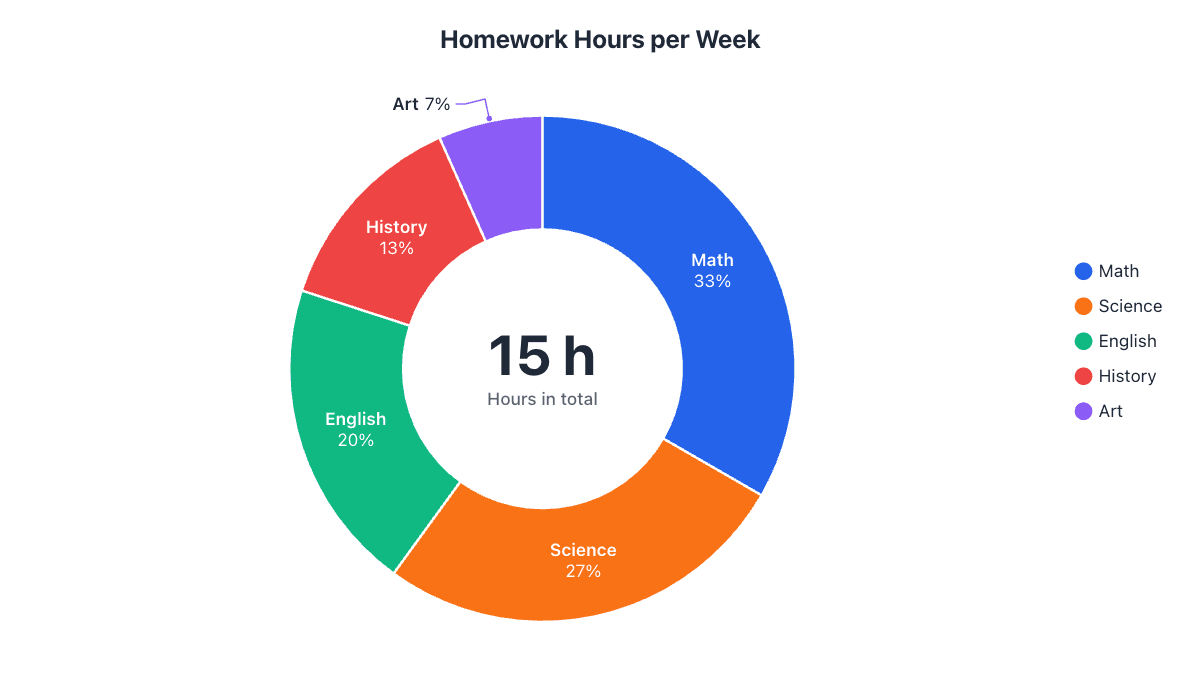
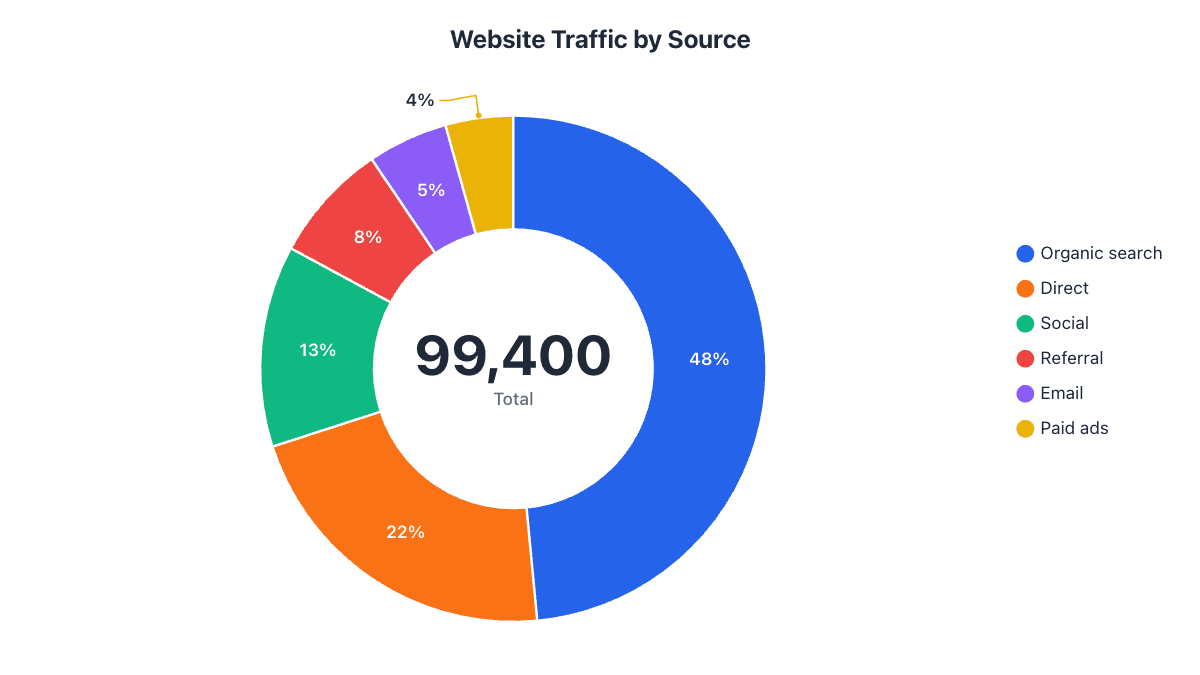
- plt.pie(values, labels=names, autopct="%1.0f%%") draws a pie with percentages.
- startangle=90 and counterclock=False start at 12 o'clock and go clockwise.
- wedgeprops={"width": 0.4} turns a pie into a donut.
- For pandas, use series.plot.pie() with the labels as the index.
- Save with plt.savefig("pie.png", dpi=200, bbox_inches="tight").
Python’s standard charting library, Matplotlib, draws a pie chart with a single function: plt.pie(). This guide starts with the smallest working example and builds up to a polished chart: percentages and values on the slices, your own colors, a pulled-out slice, a donut with a total in the middle, pandas DataFrames and high-resolution export. Every code sample below was tested with Matplotlib 3.9 and pandas 2.3.
The example is a team’s week: 160 hours split between coding, meetings, testing, code review and documentation.
Step 1: Install Matplotlib
If you don’t have it yet, install it with pip (add pandas if you’ll chart DataFrames):
pip install matplotlib pandasIn Jupyter or Google Colab, Matplotlib is usually installed already and charts appear under the cell, so you can leave out plt.show().
Step 2: A basic pie chart
import matplotlib.pyplot as plt

tasks = ["Coding", "Meetings", "Testing", "Code review", "Documentation"]
hours = [68, 30, 26, 22, 14]

fig, ax = plt.subplots()
ax.pie(hours, labels=tasks, autopct="%1.0f%%", startangle=90, counterclock=False)
ax.set_title("Where the Team's Week Goes")
plt.show()
What each argument does:
hoursis the list of values. They don’t need to add up to 100: Matplotlib works out each slice’s share.labelsnames each slice, in the same order as the values.autopct="%1.0f%%"prints each slice’s percentage with no decimals. Use"%1.1f%%"for one decimal place.startangle=90andcounterclock=Falsestart the first slice at 12 o’clock and go clockwise. Matplotlib’s default starts at 3 o’clock and goes counterclockwise, which looks odd to most readers.
Step 3: Colors, values and a pulled-out slice
autopct also accepts a function. It receives each slice’s percentage, so you can turn it back into the original value and show both:
import matplotlib.pyplot as plt

tasks = ["Coding", "Meetings", "Testing", "Code review", "Documentation"]
hours = [68, 30, 26, 22, 14]
total = sum(hours)

def label(pct):
    value = round(pct * total / 100)
    return f"{pct:.0f}%\n({value} h)"

colors = ["#2563eb", "#f97316", "#10b981", "#8b5cf6", "#eab308"]
explode = [0.08, 0, 0, 0, 0]  # pull out the first slice

fig, ax = plt.subplots(figsize=(8, 6))
ax.pie(
    hours,
    labels=tasks,
    colors=colors,
    explode=explode,
    autopct=label,
    startangle=90,
    counterclock=False,
    wedgeprops={"edgecolor": "white", "linewidth": 2},
    textprops={"fontsize": 11},
)
ax.set_title("Where the Team's Week Goes", fontsize=14, fontweight="bold")
plt.savefig("pie.png", dpi=200, bbox_inches="tight")colorstakes any Matplotlib colors: hex codes like"#2563eb"or names like"tab:blue".explodemoves slices out from the center, as a fraction of the radius. Here only the first slice moves.wedgepropsstyles the slices themselves; a white edge separates them cleanly.textpropssets the font size of the labels and percentages.
Step 4: Turn it into a donut chart
A donut is a pie with wedgeprops={"width": 0.4}: each slice becomes a ring 40% of the radius wide. The empty middle is the perfect place for a total, added with ax.text(). This version also moves the names into a legend, which keeps long labels from crowding the chart.
import matplotlib.pyplot as plt

tasks = ["Coding", "Meetings", "Testing", "Code review", "Documentation"]
hours = [68, 30, 26, 22, 14]
colors = ["#2563eb", "#f97316", "#10b981", "#8b5cf6", "#eab308"]

fig, ax = plt.subplots(figsize=(8, 5))
wedges, texts, autotexts = ax.pie(
    hours,
    colors=colors,
    autopct="%1.0f%%",
    pctdistance=0.8,                 # percentages in the middle of the ring
    startangle=90,
    counterclock=False,
    wedgeprops={"width": 0.4, "edgecolor": "white", "linewidth": 2},
)
plt.setp(autotexts, color="white", fontweight="bold")
ax.text(0, 0, f"{sum(hours)} h\ntotal", ha="center", va="center", fontsize=16, fontweight="bold")
ax.legend(wedges, tasks, loc="center left", bbox_to_anchor=(1, 0.5), frameon=False)
ax.set_title("Where the Team's Week Goes", fontsize=14, fontweight="bold")
plt.savefig("donut.png", dpi=200, bbox_inches="tight")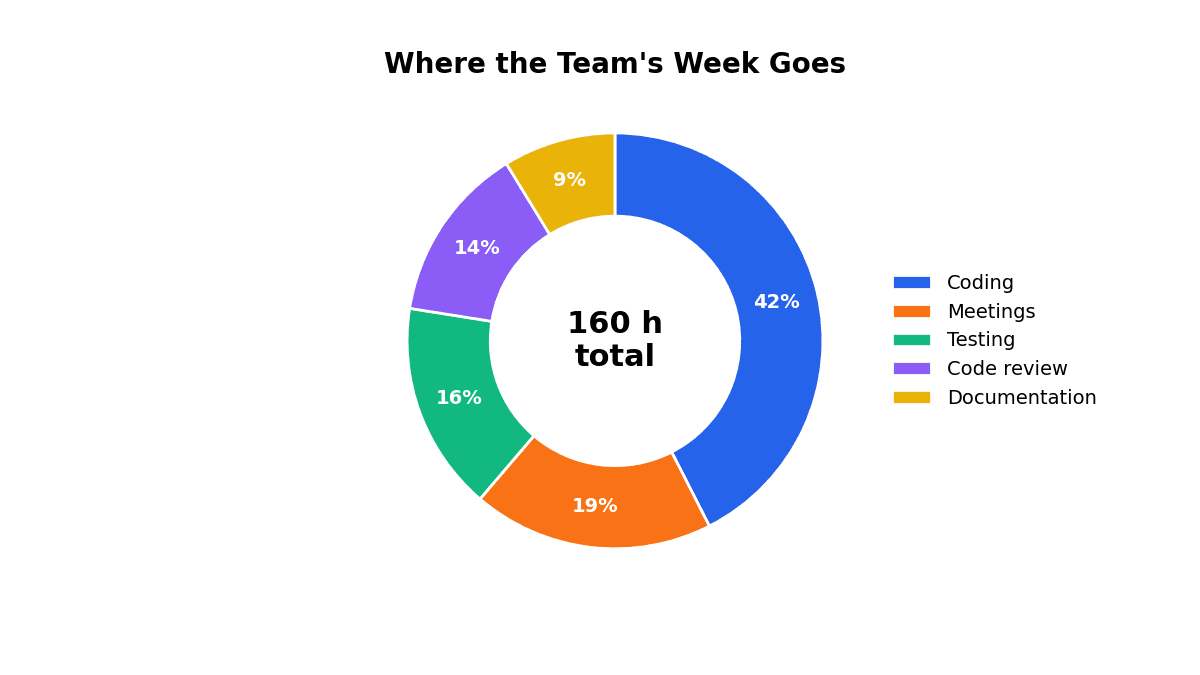
ax.pie() returns three lists: the slice shapes (wedges), the label texts and the percentage texts. Passing wedges to ax.legend() gives the legend the same colors.
Step 5: Make a pie chart from a pandas DataFrame
If your data is already in pandas, call .plot.pie() on a Series. The index becomes the slice names, so set the label column as the index first:
import matplotlib.pyplot as plt
import pandas as pd

df = pd.DataFrame({
    "task": ["Coding", "Meetings", "Testing", "Code review", "Documentation"],
    "hours": [68, 30, 26, 22, 14],
})

ax = df.set_index("task")["hours"].plot.pie(
    autopct="%1.0f%%", startangle=90, counterclock=False, figsize=(6, 6)
)
ax.set_ylabel("")  # pandas puts the column name on the y-axis
ax.set_title("Where the Team's Week Goes")
plt.savefig("pie.png", dpi=200, bbox_inches="tight")
For data that still needs counting, such as one row per survey response, use df["answer"].value_counts().plot.pie() to count each answer and chart it in one line.
Step 6: Group small slices into “Other”
Thin slices are hard to read and their labels overlap. A common fix is to merge every slice under a threshold (here 5%) into one “Other” slice:
import pandas as pd

s = pd.Series({"A": 40, "B": 30, "C": 20, "D": 4, "E": 3, "F": 2, "G": 1})

share = s / s.sum()
small = share < 0.05            # anything under 5%
grouped = s[~small]
if small.any():
    grouped["Other"] = s[small].sum()

grouped.plot.pie(autopct="%1.0f%%", startangle=90, counterclock=False)
That turns seven slices into four: A, B, C and an “Other” slice holding the remaining 10%. Why seven slices is about the limit is covered in when not to use a pie chart.
Step 7: Save a sharp image
plt.savefig() writes the chart to a file. The file type comes from the extension:
plt.savefig("pie.png", dpi=200, bbox_inches="tight")for slides and documents. Raisedpito 300 for print.plt.savefig("pie.svg")for a vector file that stays sharp at any size.plt.savefig("pie.pdf")for LaTeX papers and reports.
bbox_inches="tight" trims empty space and stops labels or a legend outside the axes from being cut off. Call savefig() before plt.show(), because showing the chart can clear the figure.
Common problems and fixes
| Problem | Fix |
|---|---|
| The pie is an oval | Recent Matplotlib versions keep pies round. In older versions, add ax.axis("equal"). |
| Labels overlap on small slices | Move names into a legend (Step 4), group small slices (Step 6), or push labels out with labeldistance=1.15. |
| Percentages sit too close to the edge | Set pctdistance: 0.6 is the default for a pie, 0.8 suits a donut ring. |
| The legend or labels are cut off in the saved file | Save with bbox_inches="tight". |
ValueError about negative values | A pie can’t show negative numbers. Remove them, or use a bar chart for that data. |
| The percentages add up to 99% or 101% | That’s rounding. Show one decimal with "%1.1f%%". |
No code needed: make the same chart online
Python is the right tool when the chart is part of an analysis you’ll rerun, or when you need hundreds of charts. For a one-off chart for a report or slide, it’s quicker to paste the numbers into the donut chart maker, adjust it visually and download PNG, SVG or PDF. You can also generate chart images from code without any libraries using the pie chart API: build a URL with your labels and values and you get an SVG back.
Frequently asked questions
How do I show percentages on a Matplotlib pie chart?
Pass autopct="%1.0f%%" to plt.pie() for whole numbers, or "%1.1f%%" for one decimal place.
How do I make a donut chart in Matplotlib?
Pass wedgeprops={"width": 0.4} to ax.pie(). Each slice becomes a ring 40% of the radius wide, and you can put a total in the middle with ax.text(0, 0, ...).
How do I make a pie chart from a pandas DataFrame?
Set the label column as the index and call .plot.pie() on the value column, e.g. df.set_index("task")["hours"].plot.pie(autopct="%1.0f%%").
Why do my pie chart labels overlap?
Small slices put labels close together. Move the names into a legend, group small slices into Other, or increase labeldistance.
How do I save a Matplotlib pie chart as an image?
Call plt.savefig("pie.png", dpi=200, bbox_inches="tight") before plt.show(). Use .svg or .pdf as the extension for vector files.
Make your own chart in seconds
Free, no sign-up, no watermark. Download PNG, SVG or PDF.
Open the Donut Chart Maker