- Insert › Chart › Pie adds a chart linked to a new Google Sheet.
- Edit the data and styling in the sheet: link icon › Open source.
- Click Update on the chart in Slides after every change.
- Insert › Chart › From Sheets imports a chart you already made.
- Slides animates the whole chart, not individual slices.
Google Slides makes pie charts with the help of Google Sheets. When you insert a chart, Slides creates a linked spreadsheet in your Drive: you type the data and style the chart in Sheets, then click Update in Slides. Once you know that, the rest is quick. This guide walks through it, plus how to use an existing sheet, animate the chart and fix the usual problems.
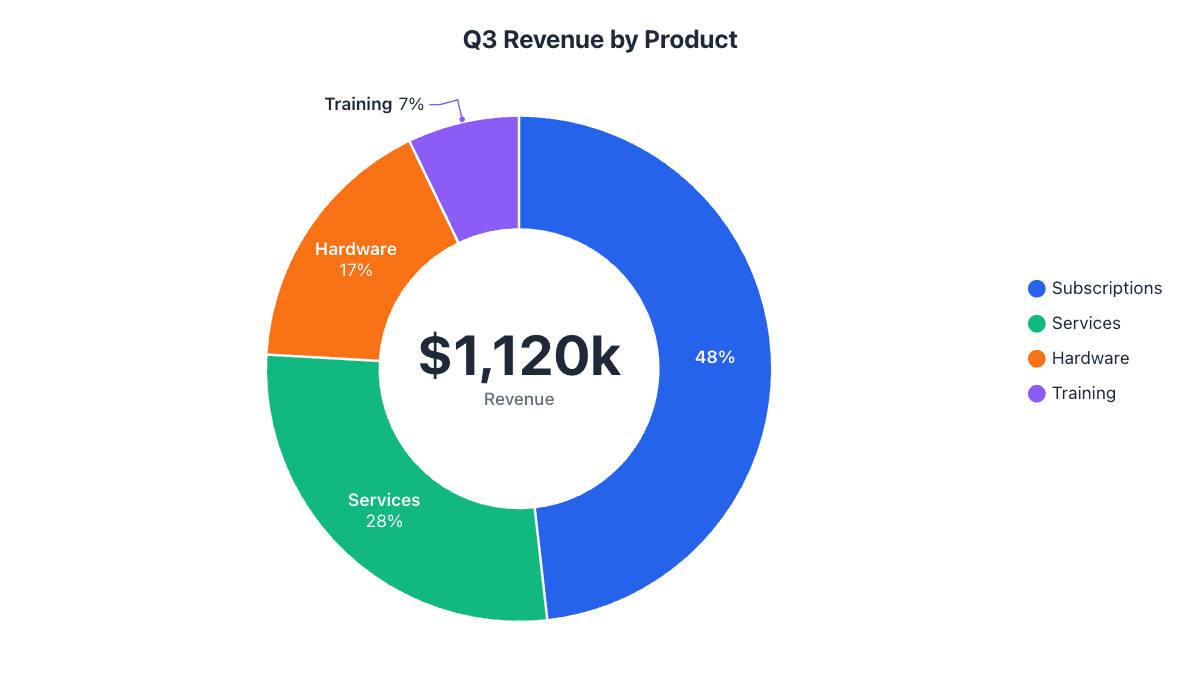
Our example is quarterly revenue of $1,120k split across four product lines.
Step 1: Insert a pie chart
- Open your presentation and go to the slide.
- Choose InsertChartPie.
A pie chart with sample data appears on the slide. Behind the scenes, Slides has created a new Google Sheet in your Drive holding that data. The chart is linked to it.
Step 2: Open the linked sheet and enter your data
- Click the chart to select it.
- Click the link icon in its top-right corner (or the three-dot menu) and choose Open source. The spreadsheet opens in a new tab.
- Type your category names in column A and your numbers in column B, replacing the samples. Delete any leftover sample rows.
| Product | Revenue ($k) | Share |
|---|---|---|
| Subscriptions | 540 | 48% |
| Services | 310 | 28% |
| Hardware | 190 | 17% |
| Training | 80 | 7% |
Step 3: Style the chart in Sheets
Slides has no chart editor of its own; all styling happens in the linked sheet. Double-click the chart there to open the Chart editor, then go to the Customize tab:
- Pie chart › Slice label: choose Percentage, Value, or Label. Labels on the slices read far better on a projector than a legend.
- Pie chart › Donut hole: set 50% or more to make a donut, which leaves room for a headline number.
- Pie slice: pick each slice, change its color, and use Distance from center to pull out the one you want to talk about.
- Chart & axis titles: edit the title and make it bigger. Legend lets you move or hide the legend.
Our Google Sheets pie chart guide covers every option in the Chart editor in more detail.
Step 4: Update the chart in Slides
Go back to the presentation tab. The chart now shows an Update button. Click it and the slide picks up your new data and styling. Repeat this whenever you change the sheet: Slides never updates linked charts on its own.
Use a chart from an existing Google Sheet
If you already have the chart in a spreadsheet:
- Choose InsertChartFrom Sheets.
- Pick the spreadsheet, then click the chart you want.
- Keep Link to spreadsheet ticked if the chart should update with the sheet, and click Import.
Untick it to paste a static copy, which is useful when you share the deck with people who can’t open the spreadsheet.
Resize, position and animate it
- Resize by dragging a corner handle so the pie stays round. For exact sizes, right-click › Format options › Size & rotation and lock the aspect ratio.
- Animate: select the chart and choose InsertAnimation. Fade in and Zoom in work well. Slides animates the chart as one picture, so you can’t reveal slices one at a time.
- Want slices to sweep in? Download an animated video of your chart from the pie chart maker, upload it to Drive and add it with InsertVideoGoogle Drive.
The faster way: make the chart online and insert it
If you don’t need the chart linked to a sheet, skip the back-and-forth: build it in the donut or pie chart maker, where you can see every change on the chart as you make it, and labels move outside thin slices automatically. Then use Copy image and paste it onto the slide, or download a PNG and choose InsertImageUpload from computer. A transparent PNG blends into any slide background.
Common problems and how to fix them
| Problem | Fix |
|---|---|
| There’s no Update button | The chart is unlinked or the sheet hasn’t changed. Re-insert it with Insert › Chart › From Sheets and keep it linked. |
| “Open source” doesn’t work for a colleague | They need at least view access to the linked spreadsheet. Share the sheet with them, or unlink the chart. |
| Some slices have no label | Sheets hides labels that don’t fit inside small slices. Show values in the legend or group small slices into “Other” (see when not to use a pie chart). |
| The chart includes a “Total” slice | Remove the totals row from the data range in the Chart editor’s Setup tab. |
| The pie looks stretched | Resize with a corner handle, or lock the aspect ratio in Format options. |
Frequently asked questions
How do I edit a pie chart in Google Slides?
Click the chart, click the link icon in its corner and choose Open source. Edit the data and styling in the spreadsheet, then click Update on the chart in Slides.
Why doesn't my Google Slides chart update?
Linked charts only change when you click Update on the chart, or Tools › Linked objects › Update all. If there is no Update button, the chart has been unlinked.
Can I show percentages on a pie chart in Google Slides?
Yes. In the linked sheet's Chart editor, go to Customize › Pie chart and set Slice label to Percentage, then update the chart in Slides.
Can I animate pie slices one by one in Google Slides?
No. Slides animates the chart as a single object. Use separate images per step, or insert an animated video of the chart.
Make your own chart in seconds
Free, no sign-up, no watermark. Download PNG, SVG or PDF.
Open the Donut Chart Maker