The data in this template
These are sample figures to show how the chart works. Replace them with your own in the table above, or paste your data from Excel or Google Sheets.
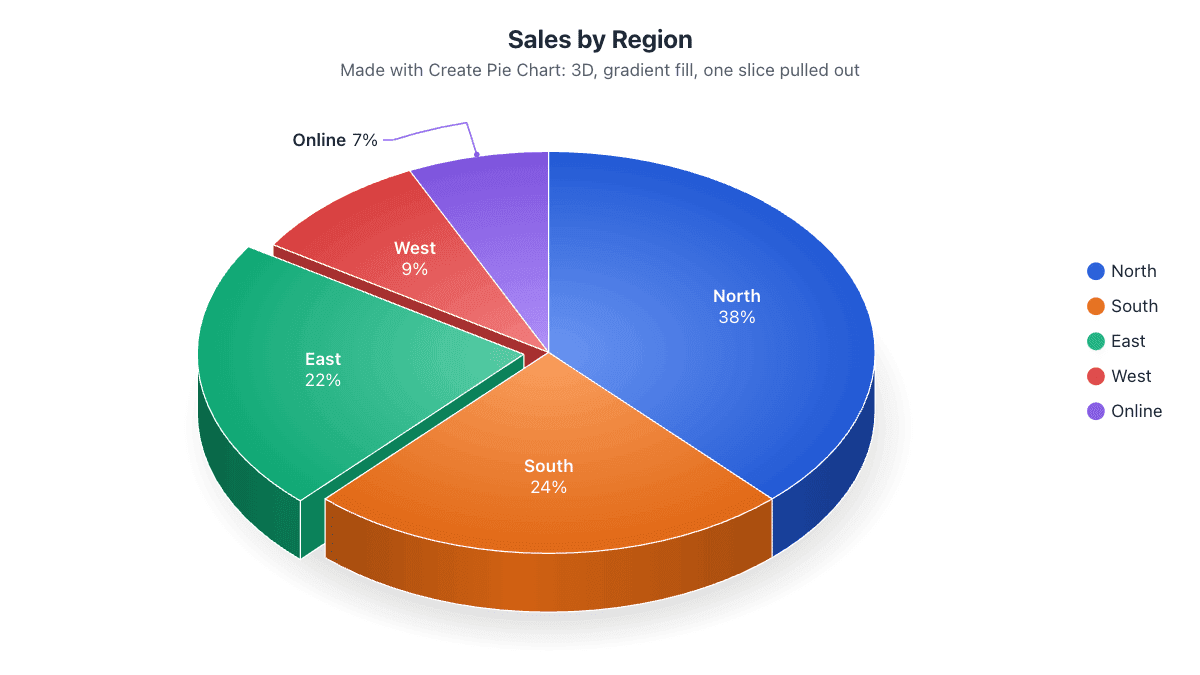
| Sales by Region | Revenue | Share |
|---|---|---|
| North | $412,000 | 33.6% |
| South | $298,000 | 24.3% |
| East | $236,000 | 19.3% |
| West | $184,000 | 15.0% |
| Online | $95,000 | 7.8% |
| Total | $1,225,000 | 100% |
What to show in a sales pie chart
A pie chart answers “where does our revenue come from?”. Use it for one period at a time: a quarter or a year. For growth over time, a line or bar chart is clearer.
Enter revenue in full figures; the table shows each region’s percentage and the legend can show the dollar amounts next to the names.
Different ways to split sales
Rename the slices to products, sales channels (online, retail, wholesale), customer segments or sales reps. If you have more than seven, group the smallest into “Other” so the chart stays readable.
Tips for this chart
- Show values in the legend and percentages on the slices.
- Pull out the top region to highlight it.
- Switch off 3D in the Data tab for a flat, more precise chart.
How to use this template
- Change the data. Type over the names and numbers in the table, or paste two columns from a spreadsheet. Plain text like “Rent 1200, Food 400” works too.
- Adjust the look. The Design and Labels tabs change colors, labels, 3D and more. Your changes are saved in this browser automatically.
- Download or share. Save it as PNG, JPG, SVG, PDF or an animated video, copy a share link, or embed it on your website.
More pie chart templates
Budget Pie Chart TemplateSee where your money goes each month.24-Hour Daily Routine Pie ChartHow you spend 24 hours, a classic school project.Survey Results Pie Chart TemplateSatisfaction scores and single-choice answers.Market Share Pie Chart TemplateCompare companies or brands in one market.Business Expenses Pie Chart TemplateOperating costs for a business or project.World Population by Continent Pie ChartHow the world’s people are spread across continents.