The data in this template
These are sample figures to show how the chart works. Replace them with your own in the table above, or paste your data from Excel or Google Sheets.
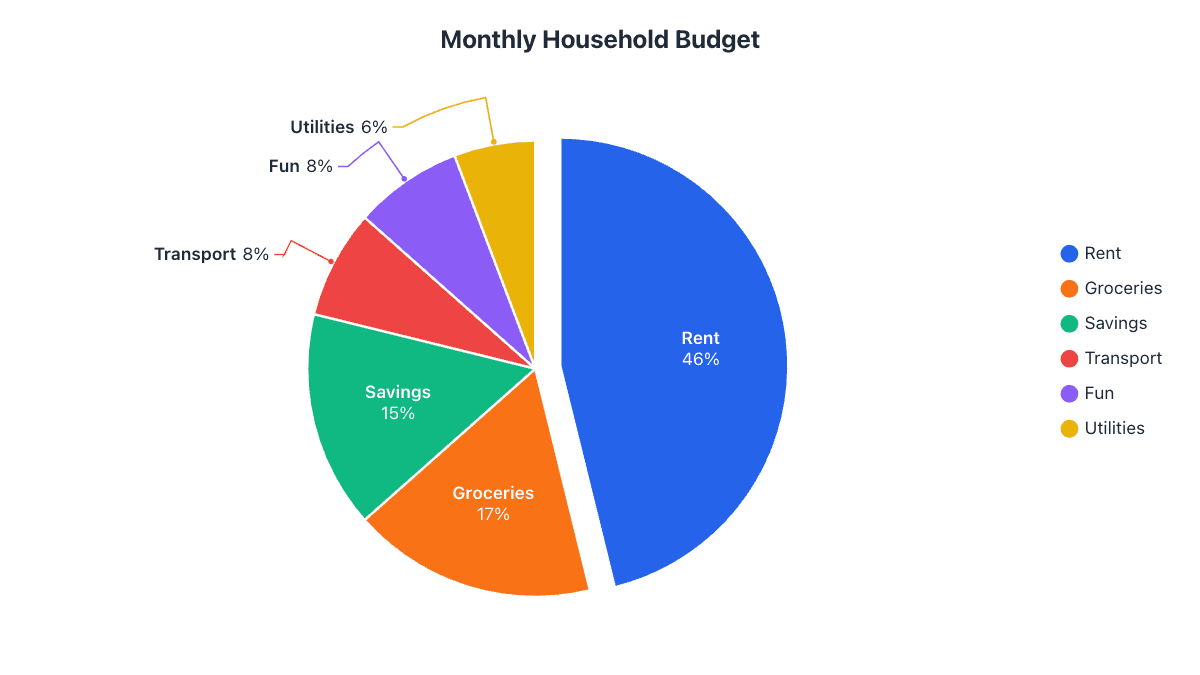
| Monthly Budget | Amount | Share |
|---|---|---|
| Rent | $1,400 | 43.8% |
| Groceries | $520 | 16.3% |
| Savings | $600 | 18.8% |
| Transport | $260 | 8.1% |
| Entertainment | $240 | 7.5% |
| Utilities | $180 | 5.6% |
| Total | $3,200 | 100% |
Why a pie chart works for a budget
A budget is a fixed whole (your monthly income or spending) split into categories, which is exactly what a pie chart shows best. One look tells you whether rent eats half your money or whether savings get a fair slice.
Enter what you actually spend, not percentages. The chart works out each category’s share for you, and the table shows the exact percentage and angle of every slice.
Check your budget against the 50/30/20 rule
A popular rule of thumb splits after-tax income into 50% for needs (housing, groceries, transport, utilities), 30% for wants (eating out, entertainment, hobbies) and 20% for savings or paying off debt.
To compare, rename your categories to Needs, Wants and Savings and add up the amounts in each. If the Needs slice is much bigger than half the pie, that’s where to look for savings.
Tips for this chart
- Keep it to six or seven categories; group small items into “Other”.
- Pull out the slice you want to talk about, such as Savings.
- Use the $ prefix in the Labels tab so values show as money.
- Make a second ring (add a column) to compare this month with last month.
How to use this template
- Change the data. Type over the names and numbers in the table, or paste two columns from a spreadsheet. Plain text like “Rent 1200, Food 400” works too.
- Adjust the look. The Design and Labels tabs change colors, labels, 3D and more. Your changes are saved in this browser automatically.
- Download or share. Save it as PNG, JPG, SVG, PDF or an animated video, copy a share link, or embed it on your website.